Overview
What is Cosmic BTC?
Cosmic BTC maps planetary cycle conditions against Bitcoin's history. It calculates where the planets are today relative to where they were when Bitcoin was born — and interprets what that configuration has historically meant for price behavior.
It does not predict prices. What it describes is the planetary cycle environment — whether the sky is currently supportive or resistant relative to Bitcoin's natal chart, and how intense that configuration is. Think of it as a weather instrument, not a trading signal.
This tool is for pattern recognition and contextual awareness only. Not financial advice. Use it alongside your own research and risk management.
Dashboard Map
A map of everything on screen
The dashboard has five zones. Each has a distinct role. Here is the full layout — every labeled region is covered in detail below.
A — Header bar
B — Planet list
C — The Chart
D — Cycle context
E — Reading panel
AHeader
BPlanet list
CChart
DCycle context
EReading panel
A · Header bar
Header bar
Always visible at the top. Shows live data and the current date context for the entire dashboard.
●
Live dot + date
Display
The blinking dot confirms the chart is calculating live positions. The date next to it shows which date the entire dashboard is calibrated to. When you use the date picker, this updates.
$
Bitcoin price
Display
Live BTC/USD price, updated periodically. The small label shows the 24h percentage change. On historical dates this reflects the price at that time.
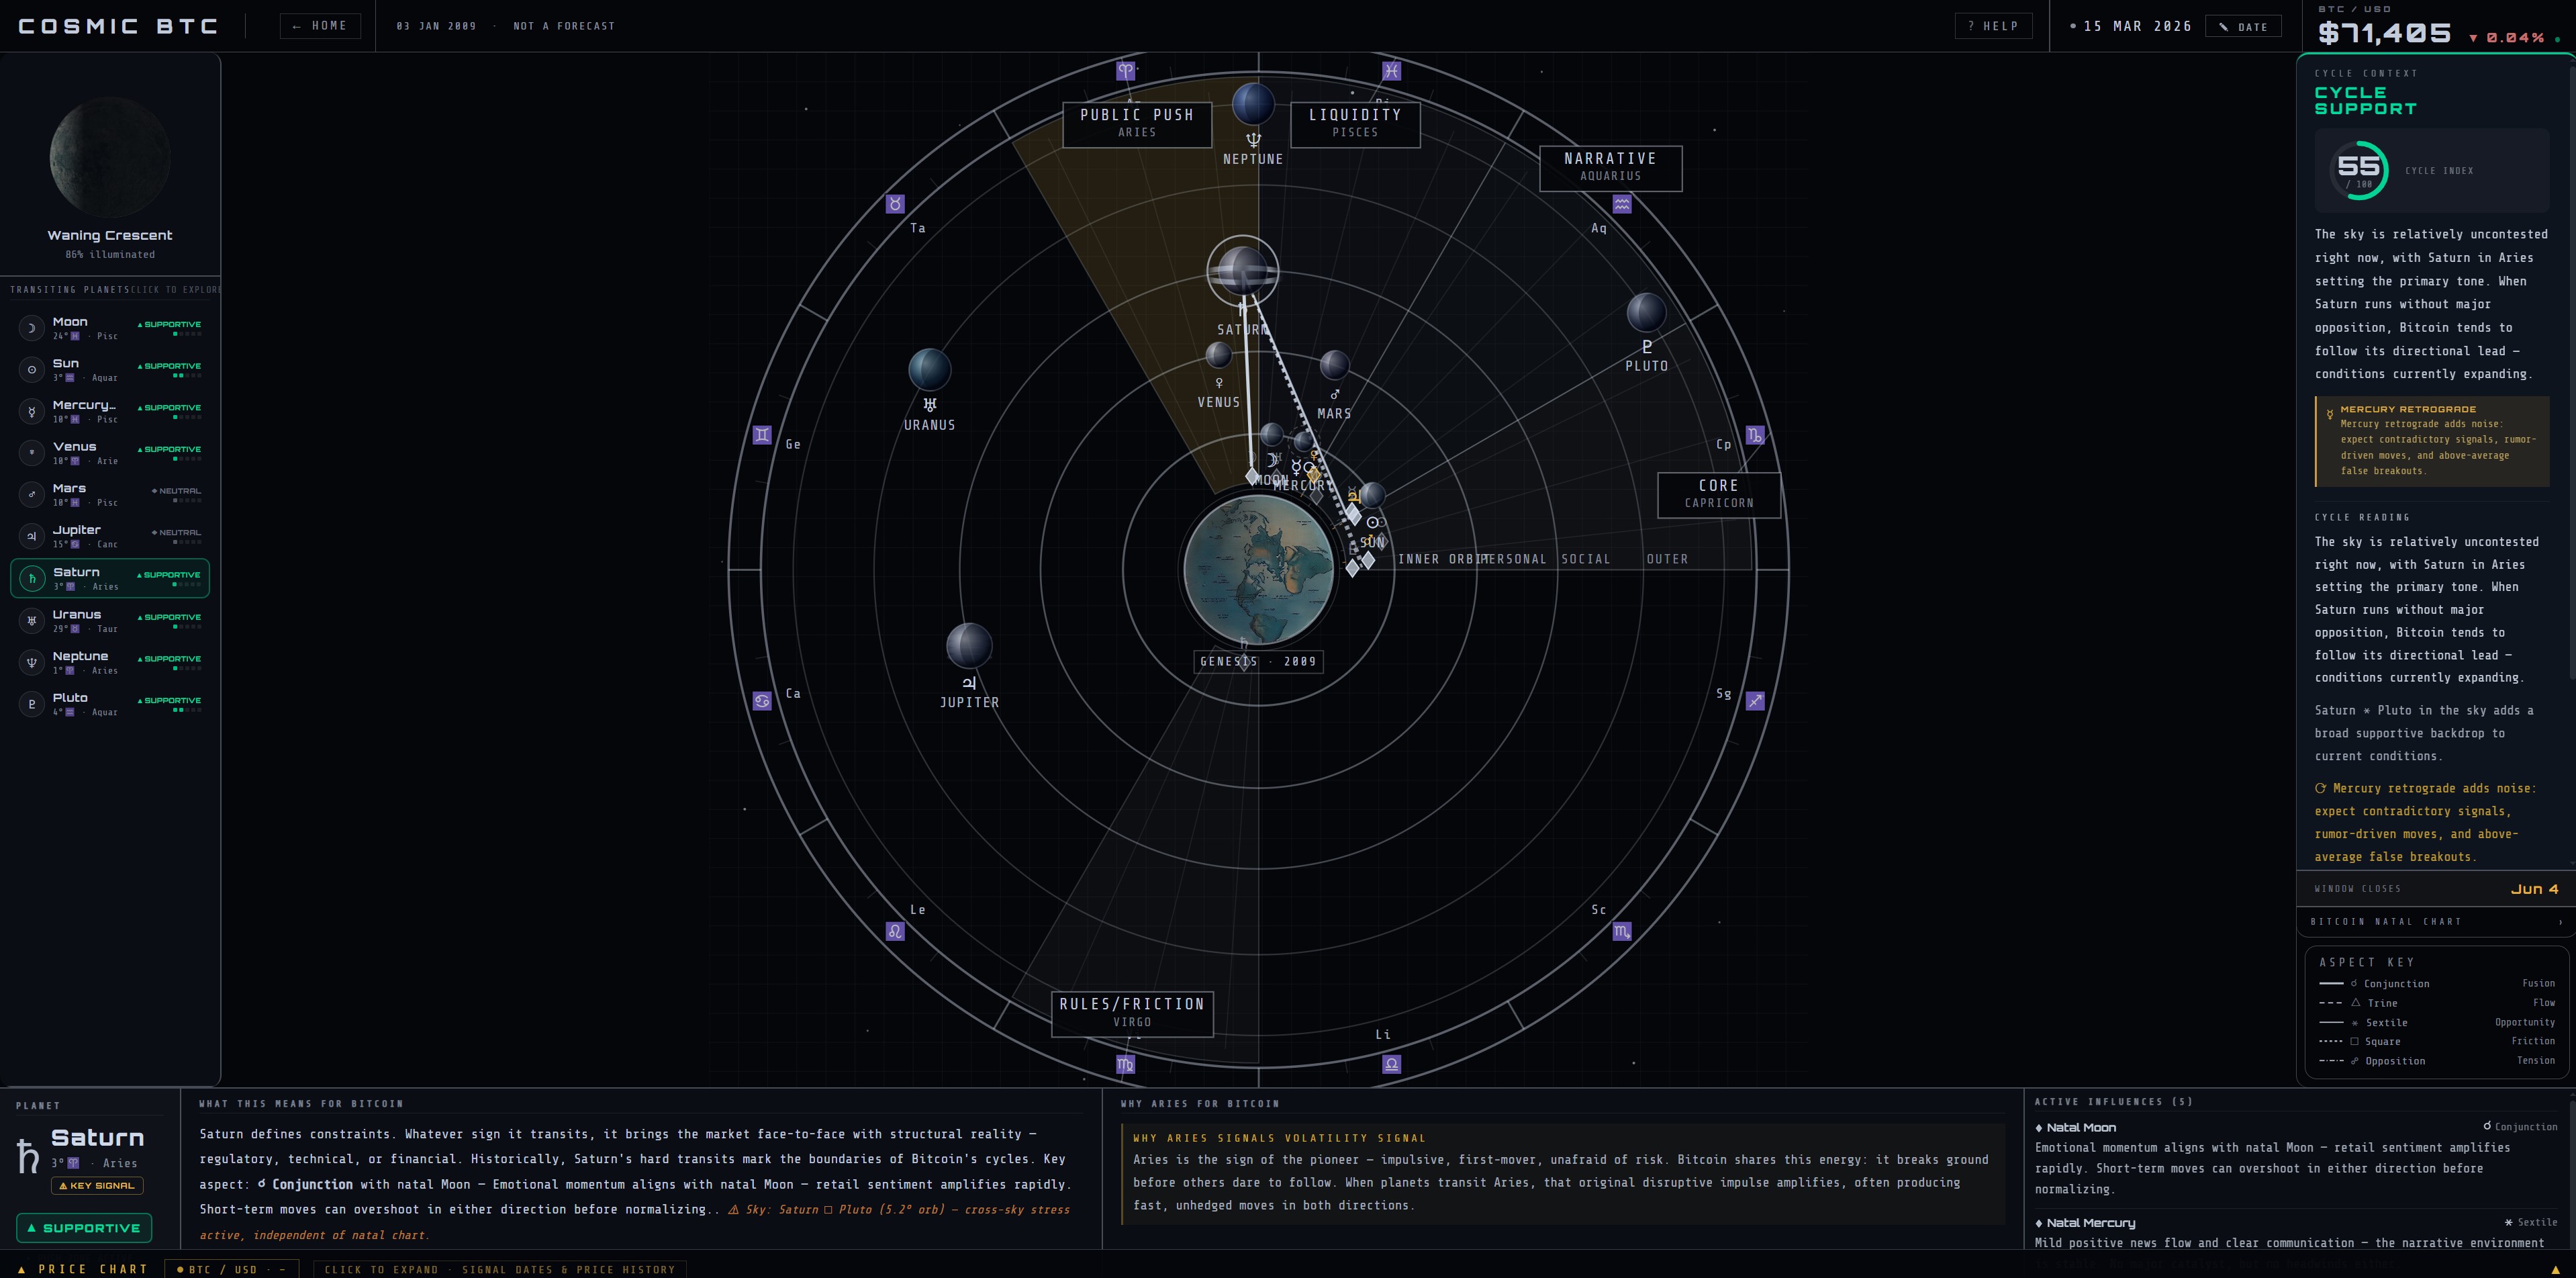
C · Center
The Chart
The circular diagram at the center — a mechanical model of the solar system overlaid with Bitcoin's birth chart and the live positions of all tracked planets.
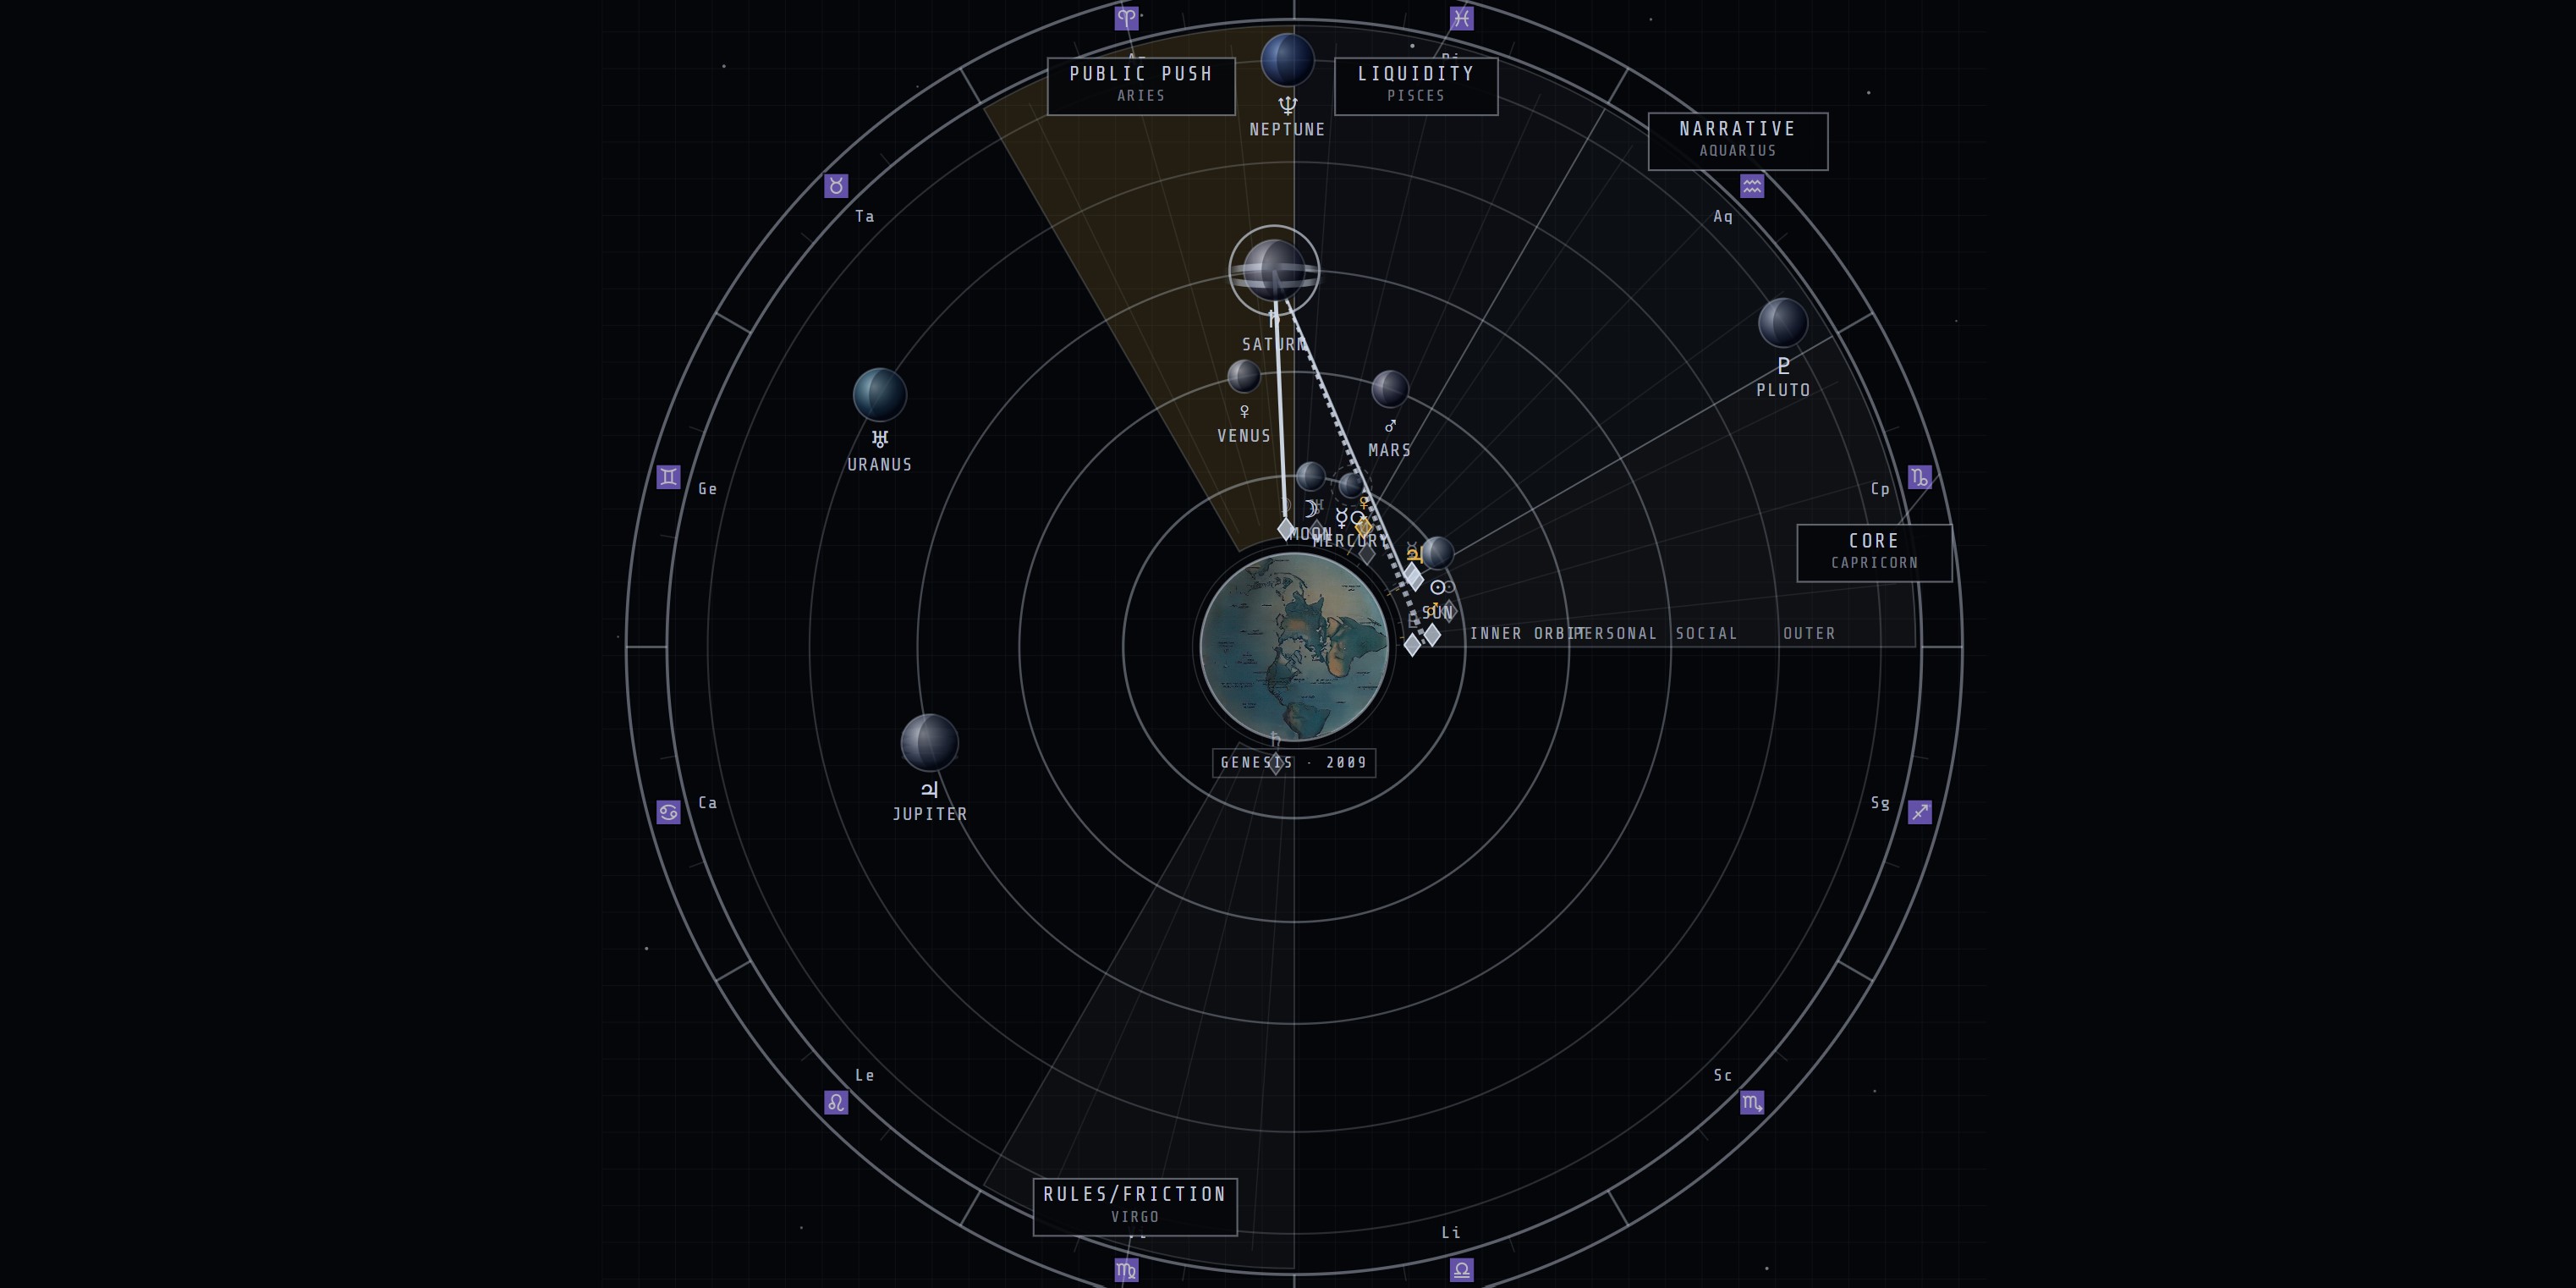
The Chart — transiting planets on orbit rings · natal points as fixed markers · aspect beams connect them
⊕
Earth / Genesis point
Display
The globe at the center labeled GENESIS · 2009. The anchor of the whole system — all planetary positions are measured from here. Bitcoin's natal planets form the fixed inner ring; transiting planets orbit above.
This is a geocentric chart — the standard format used in astrology. Earth sits at the center as the observer's point of reference. The positions are astronomically accurate; only the perspective differs from a heliocentric model.
♄
Transiting planets
Interactive
Planet symbols on the orbit rings — their real positions right now (or on your selected date). An Rx label appears next to any planet currently in retrograde.
Click any planet to select it and load its full reading in the bottom panel. The aspect beams update to show only that planet's active connections.
Clicking a planet on the Chart and clicking its row in the left panel are equivalent — they stay in sync.
×
Natal points
Interactive
Small cross markers on the inner ring — Bitcoin's fixed natal planetary positions from the genesis block. They never move. When a transiting planet aligns with one, that's an active aspect.
Hover over a natal marker to see a tooltip: planet name, natal zodiac degree, and a significance note.
─
Aspect beams
Display
Lines across the Chart connecting transiting planets to natal points. Line style encodes aspect type. Line weight reflects how tight the orb is — tighter means stronger. See the Aspect Key section for the full legend.
⊙
Zodiac ring
Display
The outermost band with 12 sign divisions and degree tick marks. Positions run clockwise from 0° Aries. Zone sector labels (CORE, NARRATIVE, etc.) sit just outside this ring.
C · Zone Sectors
Zone sectors
Five labeled arc sectors in the Chart, each spanning a zodiac sign. They describe how Bitcoin historically behaves when planets occupy that region.
Zone
Sign
What it tends to mean
CORE
Capricorn
Consolidation, institutional accumulation, structural building. Slow but foundational moves.
NARRATIVE
Aquarius
Story-driven rallies, media cycles, broad public interest. Tech narrative momentum.
LIQUIDITY
Pisces
Speculative flows, euphoric or dissolving price action. Tops and capitulations.
PUBLIC PUSH
Aries
Retail-driven surges, impulsive breakouts, aggressive momentum. FOMO cycles.
RULES / FRICTION
Virgo
Regulatory pressure, scrutiny, structural corrections. Friction with existing systems.
B · Left Panel
Planet list
The scrollable column on the left. Compact reference for all tracked planets — position, active aspect, and directional signal at a glance.
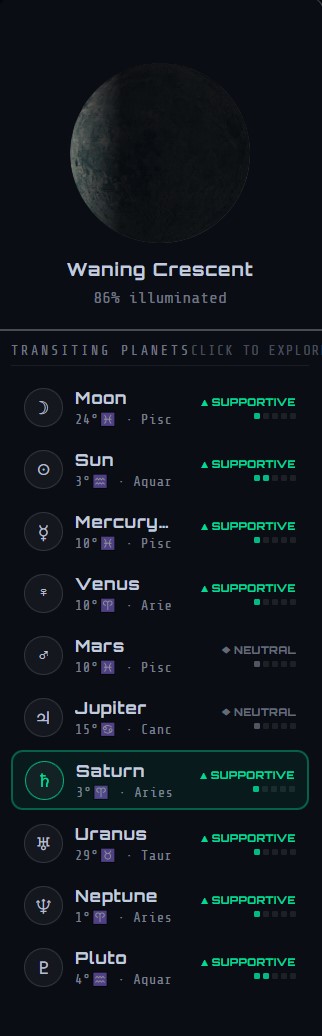
Planet list panel
≡
Planet rows
Interactive
Each row shows a planet's glyph, current zodiac degree, most active aspect, and a directional tag.
SUPPORTIVE — sky aligned with natal chart
RESISTANT — sky in tension with natal chart
NEUTRAL — no dominant signal
Click any row to select that planet and load its full reading in the bottom panel.
An amber KEY badge on a row means the planet is forming an unusually tight or historically significant aspect right now — these drive the cycle index most.
The Moon completes a cycle every 29.5 days. New and Full Moons tend to produce above-average Bitcoin volatility.
D · Right Panel
Cycle context
The primary qualitative read — what the cycle index means in plain terms, which planets are driving it, and how long the current window lasts.
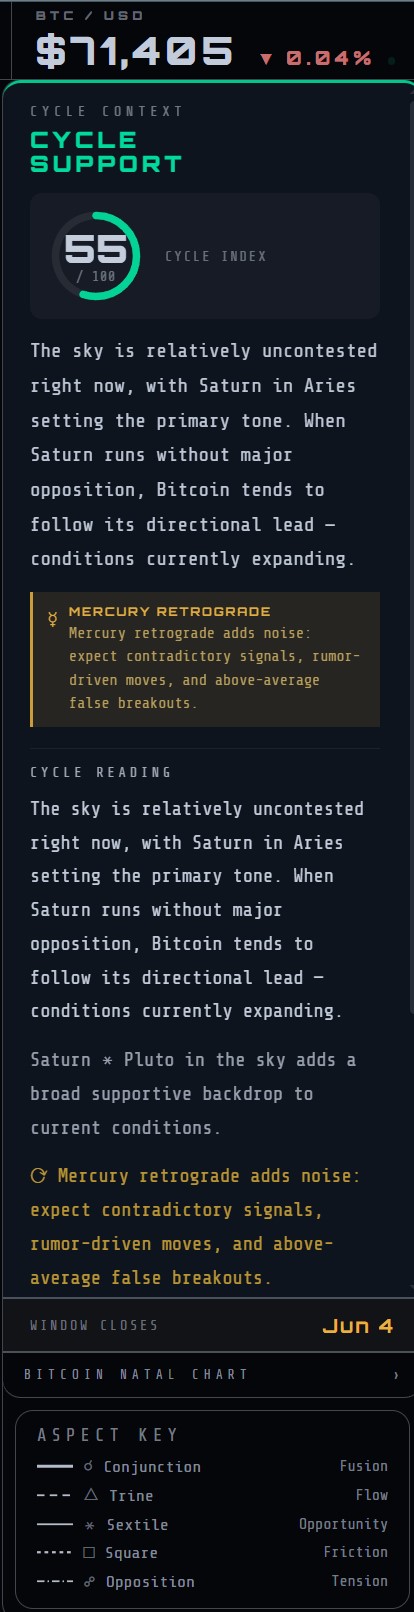
Cycle context block — state indicator + synthesis + drivers
⊙
State indicator
Display
CYCLE SUPPORT
CYCLE PRESSURE
CYCLE TENSION
CYCLE QUIET
CYCLE SUPPORT = dominant aspects are aligned with Bitcoin's natal chart. CYCLE PRESSURE = dominant aspects are in tension with it. CYCLE TENSION = significant signals on both sides. CYCLE QUIET = low confluence, quiet sky.
✦
Synthesis + drivers
Display
A short paragraph giving the "why" behind the score, followed by chips showing which planets are driving it and in which direction.
⏱
Window closes
Display
Countdown to when the dominant aspect window closes — how long these conditions are likely to persist. Amber = change is imminent.
⚠
Divergence warning
Display
Appears when the cycle index strongly conflicts with recent price action. May signal a coming reversal, or that macro forces are overriding the cycle.
D · Right Panel
Cycle index score
The large number in the right panel. A single composite value summarizing the total planetary cycle environment for the selected date.
67
Weighted sum of all active aspects. Outer planets (Saturn, Jupiter) carry more weight than inner planets. Score is a cycle condition indicator — not a price forecast.
A score of 80 does not guarantee a rally. It describes the energetic environment that has historically been favorable — not what will happen next.
D · Right Panel
Bitcoin natal chart drawer
A collapsible panel beneath cycle context. Bitcoin's natal planetary positions — the fixed reference layer all transits are measured against.
›
BITCOIN NATAL CHART toggle
Interactive
Bitcoin's birth data: 03 Jan 2009 · 18:15 UTC · London. When open, lists all natal planets with zodiac degrees and significance notes for key placements.
Click the BITCOIN NATAL CHART header row to toggle open/closed. The arrow rotates to confirm state.
Bitcoin's natal Saturn in Virgo (RULES/FRICTION zone) is the most watched placement — transits there strongly correlate with regulatory news cycles and structural corrections.
D · Right Panel
Aspect key
A static reference at the bottom of the right column. The five geometric angles that define all planet relationships in the dashboard.
Aspect
Angle · keyword
Meaning
☌
Conjunction
0° · Fusion
Energies merge — amplification or collision.
△
Trine
120° · Flow
Most supportive. Ease and momentum.
⚹
Sextile
60° · Opportunity
Mild support. Openings that need activation.
□
Square
90° · Friction
Tension. Correlates with corrections.
☍
Opposition
180° · Tension
Polarizing. Peaks, reversals, tipping points.
E · Bottom Panel
Reading panel
The horizontal bar along the bottom. Select any planet to load the full analysis for its current transit across four columns.
Reading panel — active state after planet selection · four-column layout
▭
Col 1 — Planet header
Display
Planet glyph, full name, current zodiac degree and sign, and the zone it is currently moving through.
◧
Col 2 — Cycle interpretation
Display
What this transit has historically meant for Bitcoin — behavior it tends to accompany, how long it lasts, what to watch for. Plain language.
◨
Col 3 — Active aspects
Display
All currently active aspects for the selected planet: which natal point, aspect type, exact orb in degrees, directional signal, and how long each window remains open.
◩
Col 4 — Historical note
Display
Context from previous occurrences of this same transit — what Bitcoin's price did the last time this configuration was active. A data point, not a guarantee.
⌖
Paywall overlay — future dates
Pro only
When you navigate to a future date, the panel blurs and locks for free users. Future date forecasting is Pro only.
Click "Unlock Predictions" on the overlay to open the Pro flow.
E · Bottom Panel
Range & date controls
Controls that determine what time period the chart shows and which date the dashboard is calibrated to.
↔
Range buttons — 1D 7D 1M 3M 6M 1Y 2Y ALL
Interactive
Preset time range selectors for the price chart. 2Y and ALL ranges are Pro only — clicking them as a free user triggers the subscription prompt.
The longest range is the most revealing — you can see exactly how confluence windows aligned with Bitcoin's major price moves since genesis.
◷
Date picker
Interactive
Travel to any specific date. The entire dashboard recalculates — planet positions, aspects, cycle index, and readings all update to reflect that moment in time.
Enter a date or use the calendar picker. Past dates are available free. Future dates require Pro.
Try a major Bitcoin event — a halving, an ATH, a crash — and see what the cycle index was showing at that exact moment.
E · Bottom Panel
Price chart
A collapsible BTC/USD price chart docked to the bottom of the screen. Hidden by default — click the bar to reveal it.
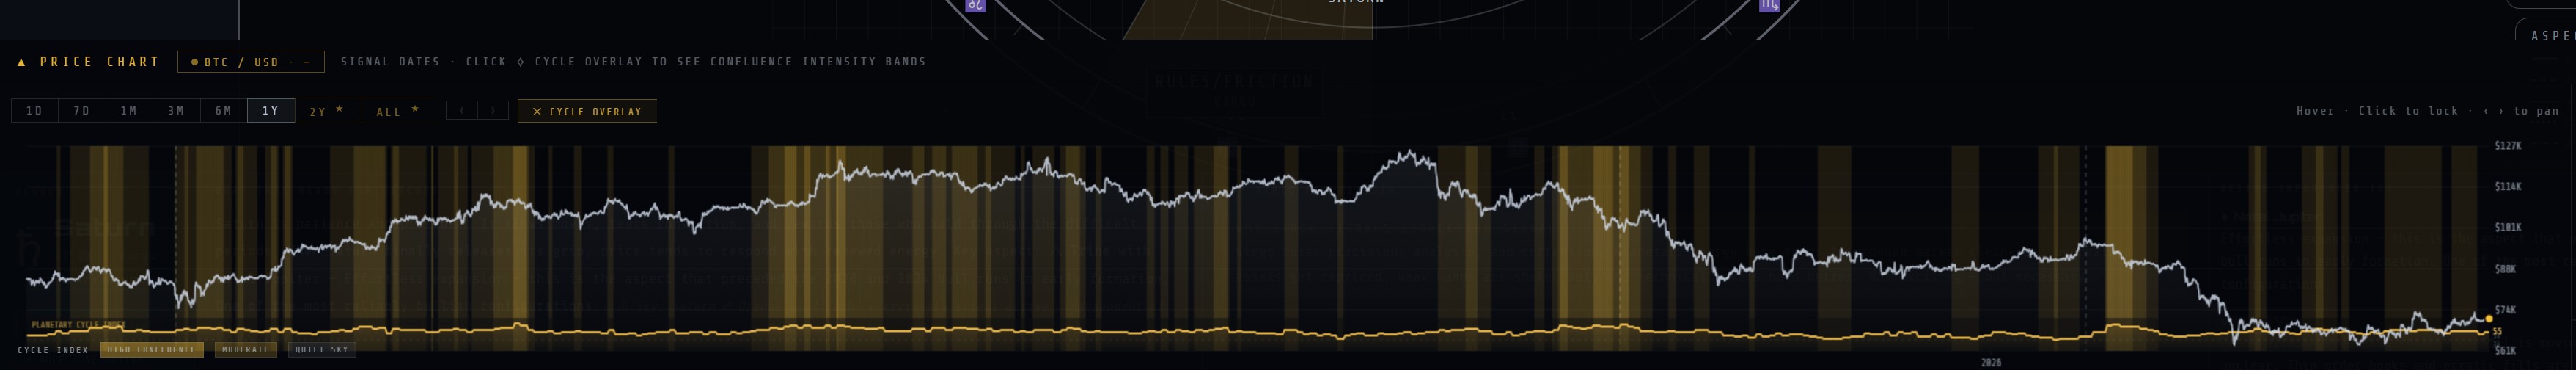
Price chart panel — open state · BTC/USD · Cycle Overlay active · Signal Dates right column
▲
▲ PRICE CHART bar
Interactive
The narrow bar along the very bottom of the screen. It is a toggle — the chart is hidden until you open it.
Click the bar to expand the price chart panel upward. Click again to collapse.
Once open, activate the Cycle Overlay to see how the Cycle Index score tracked against price over time.
⊘
Cycle Overlay
Interactive
When the price chart is open, a ⊙ CYCLE OVERLAY button appears. This overlays the historical Cycle Index bands onto the price chart. Gold bands = high confluence.
Click "⊙ CYCLE OVERLAY" to toggle the bands on and off. Direction is shown in the reading panel, not the bands.
The Signal Dates panel on the right lists dated signals with price context. Click any date to jump the entire dashboard to that moment.